A potted history of expert judgements of left-right positions
parties
measurement
Author
Chris Hanretty
Published
April 20, 2023
Most of the time when we want to explain what parties do we point to their position on the left-right dimension. Except that we can’t really “point” to anything, because ‘position on the left-right dimension’ is not something you can touch or weigh. As a result, when we want to measure parties’ positions, we often rely on expert judgements. Here’s a potted history of those judgements:
Morgan (1976) is the earliest example of soliciting expert judgements of party positions. As part of his PhD researcher, Morgan wrote to 160 country experts asking them to place parties for pre- and post-war periods according to expert-defined 0-100 scales. Most of the experts who replied (\(n \approx 100\)) gave positions on a left-right scale, but whether due to epistemological squeamishness or some other reason, Morgan scaled the trimmed mean of these responses so that left-most party was positioned at zero, and the right-most at 100. The thesis in general is fascinating – I don’t know how many theses after this included, in the body of the text, quotes from French academic articles without providing translation. Certainly it’s unusual in blending country expertise and mathematical sophistication.
CASTLES and MAIR (1984) asked a series of country experts to place parties in their country on a labelled eleven point scale (0-10), from “ultra-left” (0) to “moderate left” (2.5) and “centre” (5), with corresponding labels for the moderate- (7.5) and ultra-right (10). The authors report average placements for 119 parties in 17 different political systems. The average number of experts per country was just under seven. Perhaps to assuage readers’ sensibilities, the authors put “expert” in scare quotes in the title of the piece. One former EJPR editor, Mogens Pedersen, described the work as “audacious” – but not so audacious that the article was sent out to peer review, with Pedersen and Derek Urwin happy to accept the article as was (Pedersen et al. 1997). The manuscript reports the average placement by experts, together with the range, which might be converted to a standard error by dividing by four or some other adjustment
Huber and Inglehart (1995), although not the next expert survey by chronology, follows on quite nicely from CASTLES and MAIR (1984), in that it asks experts to place parties on a left-right scale, but also asks experts about the bases for their party placements on this scale – that is, whether they are interpreting left-right to mean something about economic policy, cultural issues, or something else. Huber and Inglehart’s data is the earliest data-set still available online in machine-readable format.
Laver and Hunt (1992), concerned by the potential vagueness of the left-right scale, asked experts to place parties on eight different policy domains, with labelled endpoints on a 1-20 scale. This survey inspired the follow-up exercise in 2003/4, published as Benoit and Laver (2006) (“PPMD”). Researchers who are interested in an overall left-right scale can either use a specific dimension which they view as the heart of the left-right dimension, or rely on some kind of factor analysis or principal component analysis.
Although the Chapel-Hill expert surveys are primarily known for their expert judgements of party positions on European integration, they do include measures of party’s general left-right position. Although the geographic coverage of Chapel Hill has historically been limited to EU member states or candidate countries, there are now a couple of regional offshoots in Latin America and Israel.
The Democratic Accountability and Linkages Project (DALP), run by Herbert Kitschelt, offers a wide range of left-right placements for parties at a single point in time (2008), as a by-product of an investigation into parties’ relationship with mass publics. A second wave of the survey is promised.
The V-Party project has used the measurement machinery of the V-Dem project to produce continuous measures of left-right position. Experts are asked to place parties on a labelled 1-5 scale; a measurement model then allows for differences between experts in how they use the scale. The resulting measure is generally available for parties with more than five percent of the vote in election years from 1975 onwards.
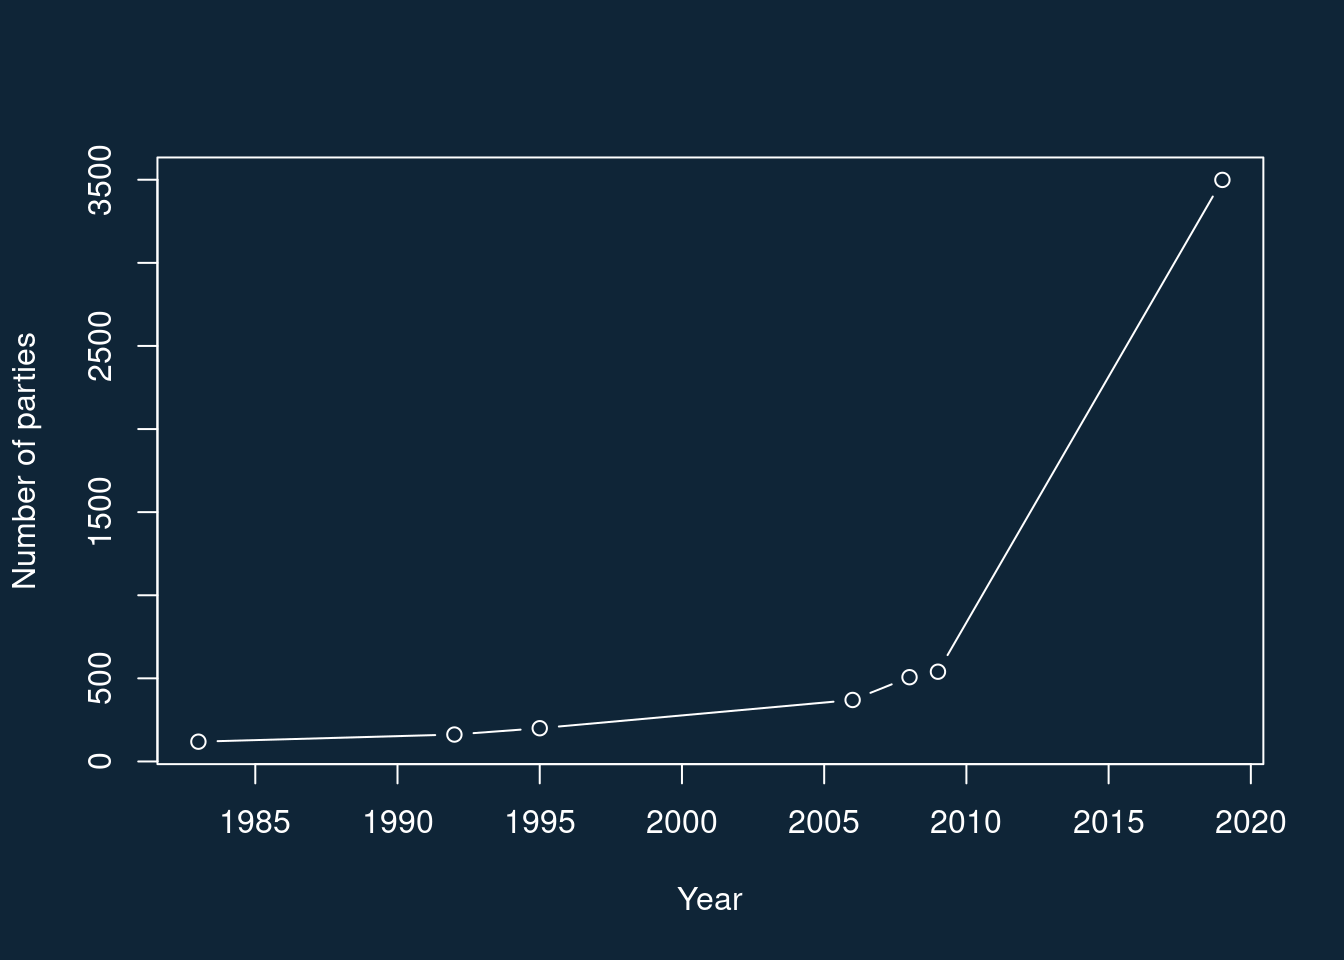
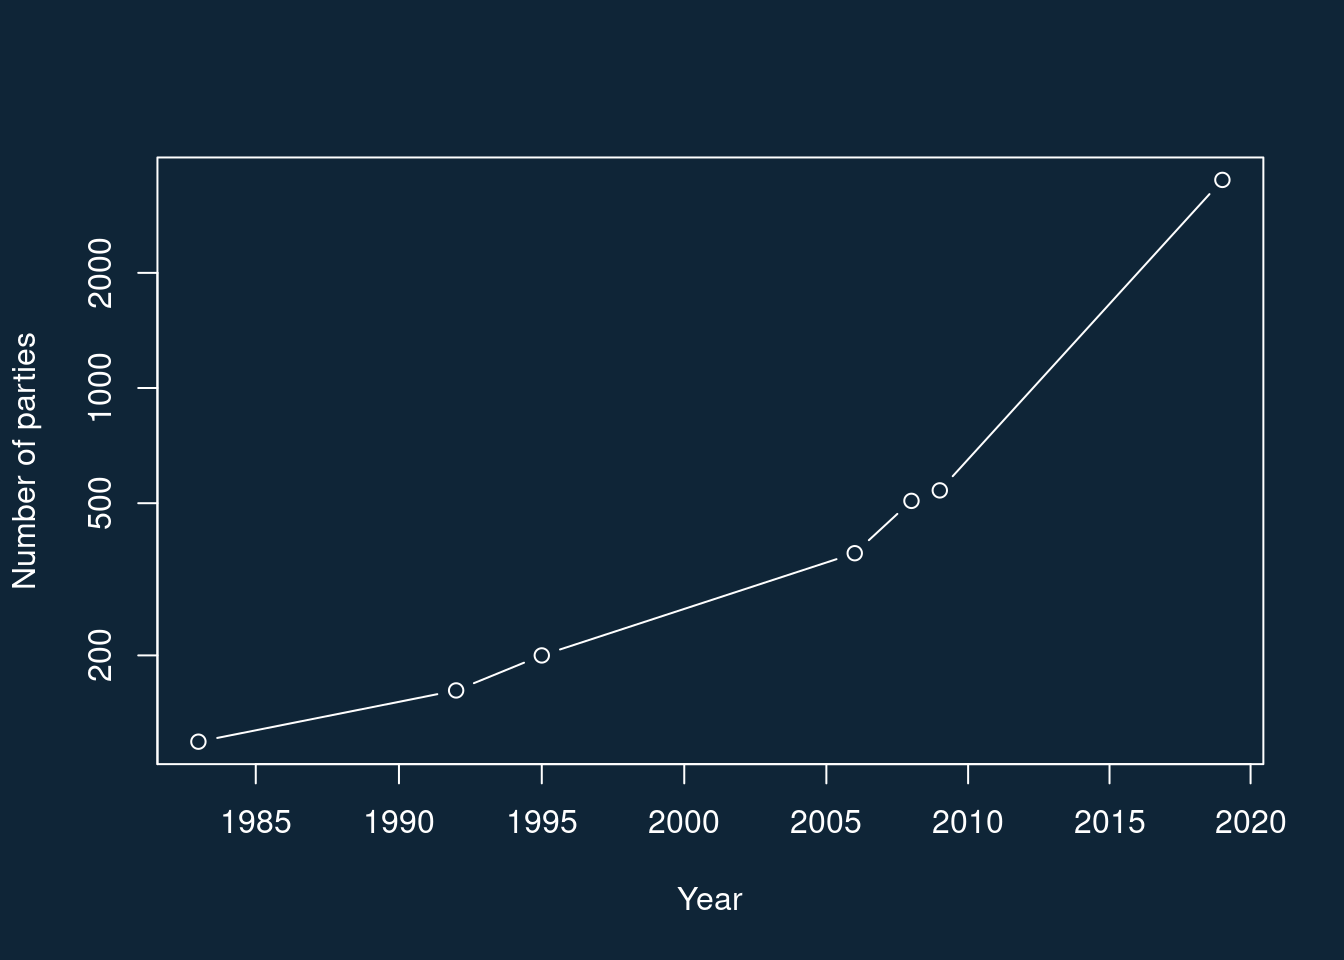
Progress, in terms of the number of parties evaluated, has been rapid:
### Using data from the partyfacts project: https://partyfacts.herokuapp.com/data/suppressPackageStartupMessages(library(tidyverse))plot_df <-tribble(~source, ~year, ~nparties,"Castles and Mair", 1983, 119,"Laver and Hunt", 1992, 162,"Huber and Inglehart", 1995, 200,"Chapel Hill", (2019+1999)/2, 540,"PPMD", 2006, 370,"DALP", 2008, 507,"V-Party", 2019, 3499) |>arrange(year)par(bg ="#0f2537", fg ="white", col.lab ="white", col.axis ="white",col.main ="white", col.sub ="white")with(plot_df,plot(year, nparties,xlab ="Year",ylab ="Number of parties",type ="b"))
It’s not quite exponential growth, but it’s somewhere close. Perhaps if we replaced it with the number of party-years measured, we would have a true case where our knowledge has grown exponentially…
References
Benoit, Kenneth, and Michael Laver. 2006. Party Policy in Modern Democracies. Routledge.
CASTLES, FRANCIS G, and PETER MAIR. 1984. “Left–Right Political Scales: Some ‘Expert’judgments.”European Journal of Political Research 12 (1): 73–88.
Huber, John, and Ronald Inglehart. 1995. “Expert Interpretations of Party Space and Party Locations in 42 Societies.”Party Politics 1 (1): 73–111.
Laver, Michael, and W Ben Hunt. 1992. Policy and Party Competition. Routledge.
Morgan, Michael-John. 1976. “The Modelling of Governmental Coalition Formation: A Policy-Based Approach with Interval Measurement.” PhD thesis, University of Michigan.
Pedersen, Mogens N, Peter Mair, and Francis G Castles. 1997. “Left–Right Political Scales.”European Journal of Political Research 31 (1): 147–57.