suppressPackageStartupMessages({
    library(tidyverse)
    library(manifestoR)
    library(vdemdata)
    library(brms)
})Almost nothing is measured without error. Sometimes we can make the error very small. Particle physicists are able to measure many quantities very accurately. The situation in the social sciences is different. Lots of interesting things are very hard to measure accurately (even granting that we can quantify them).
This is certainly true of party positions on the left-right dimension. There are different approaches to measuring party positions, and they give different results. Famously, the longest-lasting data series of party positions often gives very different results to surveys of experts, or even results which defy common sense, such as placing the Greek Communist Party on the right.
Often when we want to summarize the degree to which two measurements measure the same thing, we measure the correlation between two measures. Here’s how we might calculate the correlation between two measures of party position: data from the Manifesto Project, and data from V-Party.
We’d begin by loading the necessary libraries:
and then getting in each source of data, starting with the Manifesto Project data.
marpor_apikey_locn <- "~/Dropbox/tmp/manifesto_apikey.txt"
mp_setapikey(key.file = marpor_apikey_locn)
marpor <- mp_maindataset()
Connecting to Manifesto Project DB API...
Connecting to Manifesto Project DB API... corpus version: 2023-1 ### Remove missings
marpor <- marpor |>
filter(progtype != 99)
### Remove manifestos with no sentences, or which lack information on this
marpor <- marpor |>
filter(!is.na(total)) |>
filter(total > 0)Here I use the “logit RILE” left-right measure, which is explained in Lowe et al. (2011). Becaus the V-Party data is measured at the level of the party-year, I aggregate over manifestos from the same year.
marpor$lr <- mp_scale(marpor, scalingfun = logit_rile)
### Aggregate to the party-year level
marpor_partyyear <- marpor |>
    mutate(Year = year(edate)) |>
    group_by(party, Year) |>
    summarize(lr = mean(lr, na.rm = TRUE),
              .groups = "drop")
Now we can load the V-Party data:
data("vparty")

vparty <- vparty |>
    dplyr::select(pf_party_id, country_text_id, year,
                  v2pariglef, v2pariglef_sd) |>
    filter(!is.na(v2pariglef)) |>
    distinct()
In order to combine these two data-sets, we’ll use the PartyFacts lookup file.
pf_lu <- read.csv("partyfacts-external-parties.csv") |>
    filter(dataset_key == "manifesto") |>
    dplyr::select(dataset_party_id, partyfacts_id) |>
    mutate(dataset_party_id = as.numeric(dataset_party_id))

marpor_partyyear <- left_join(marpor_partyyear,
                              pf_lu,
                              by = join_by(party == dataset_party_id))

dat <- left_join(vparty |> distinct(),
                 marpor_partyyear,
                 by = join_by(pf_party_id == partyfacts_id,
                              year == Year),
                 multiple = "first")
With this in hand, we can calculate the correlation between these two measures.
(rho <- cor.test(dat$v2pariglef, dat$lr, use = "pairwise"))
    Pearson's product-moment correlation

data:  dat$v2pariglef and dat$lr
t = 32.017, df = 2531, p-value < 2.2e-16
alternative hypothesis: true correlation is not equal to 0
95 percent confidence interval:
 0.5085922 0.5640555
sample estimates:
      cor
0.5369037
A correlation of 0.54 is… pretty lousy for two attempts to measure the same concept. If the correlation between two measures is as bad as this, then articles which attempt to explain party left-right positioning on the basis of manifesto data are going to give substantively different conclusions to articles which explain party left-right positioning on the basis of expert placements.
But have we been too hasty? I said that nothing is measured without error, and both of these data-sets allow us to calculate the degree of measurement error which applies to each observation. If that measurement error is tiny, relative to the spread of the data, then the correlation we’ve just achieved is as good as it gets. But if the measurement error is large relative to the spread of the data, then that measurement error is going to attenuate the correlation coefficient we retrieve. Here’s an example:
set.seed(647)
n_obs <- 1000
x <- rnorm(n_obs)
err_sds <- c(0.1, 0.2, 0.5, 1)
correls <- rep(NA, length(err_sds))
for (e in err_sds) {
    y <- x + rnorm(n_obs, mean = 0, sd = e)
    correls[which(err_sds == e)] <- cor(x, y)
}

plot(err_sds, correls,
     xlab = "SD of random noise",
     ylab = "Observed correlation",
     type = "b")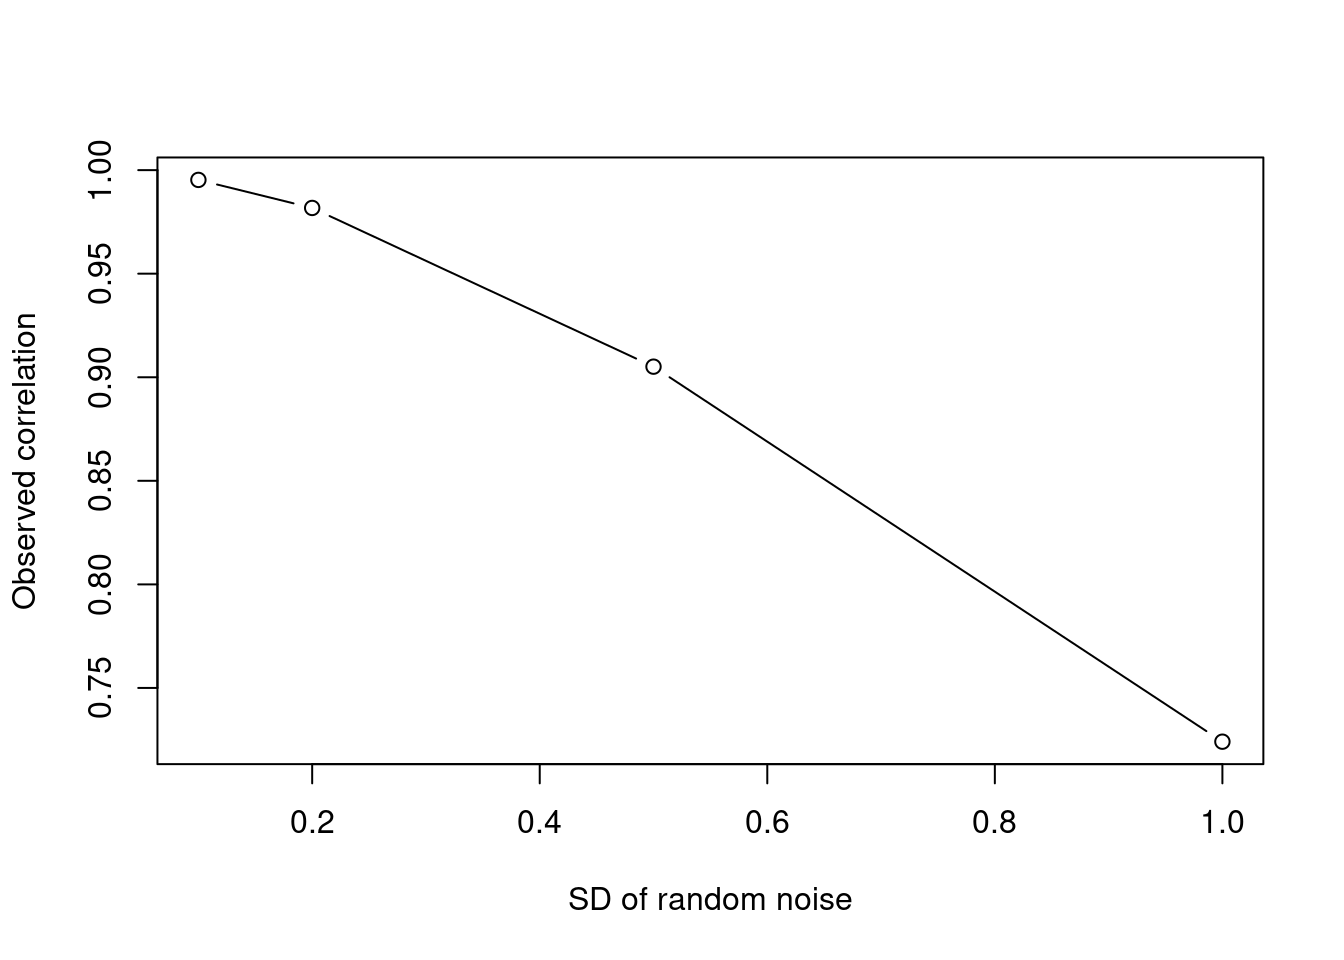
We’ve been able to take one thing, copy it, add on some noise, and calculate a correlation. The more dispersed the noise we added, the lower the correlation. What if the same thing is happening for our measures of party positions?
In order to account for this measurement error, we need to calculate the measurement error for our two data-sets. The V-Party data includes this measurement error as a supplied variable, but we need to do a bit more work for the Manifesto Project data. The dominant approach to calculating measurement error in this data source is to repeatedly sample (with replacement) sentences from a manifesto, calculate the (logit) RILE score on the basis of the sample drawn, and then calculate the standard deviation of these bootstrap replicates. Unfortunately, this takes a bit of time.
### this will take a while
if (file.exists("boots.rds")) {
    boots <- readRDS("boots.rds")
} else {
    boots <- mp_bootstrap(marpor, fun = logit_rile)
    saveRDS(boots, file = "boots.rds")
}


marpor$logit_rile <- boots$logit_rile
marpor$logit_rile_sd <- boots$sd
marpor$logit_rile_var <- marpor$logit_rile_sd ^ 2
Just as I did before, I’ll combine results from the same party in the same year. Here, because I’m being fancy and showing that I understand how to propagate error, I’ve calculated a precision-weighted mean, and calculated the standard error on the mean of these measures
marpor_partyyear <- marpor |>
    mutate(Year = year(edate)) |>
    group_by(party, Year) |>
    summarize(lr = weighted.mean(logit_rile, 1 / logit_rile_var),
              se = sqrt(sum((1/n())^2 * sum(logit_rile_var))),
              .groups = "drop")
I can now add back on the identifiers I need:
marpor_partyyear <- left_join(marpor_partyyear,
                              pf_lu,
                              by = join_by(party == dataset_party_id))

dat <- left_join(vparty |> distinct(),
                 marpor_partyyear,
                 by = join_by(pf_party_id == partyfacts_id,
                              year == Year),
                 multiple = "first")
Correcting for attenuation (1)
Now that we have a data-set with two measures and two sets of measurement errors, we can work out how much the measurement error is attenuating or deflating our recovered correlation. The first approach we’ll try is to use the average measurement error, and a formula to correct for attenuation which comes from Spearman (yes, that Spearman).
The correction we use is that the true correlation \(\rho\) is equal to the estimated correlation \(r\) divided by the square root of the production of the two measures of reliability for each variable:
\[ \rho = \frac{r_{xy}}{\sqrt{r_{xx} r_{yy}}} \]
where
\[ r_{xx} = 1 - \frac{\sigma_E^2}{\sigma_X^2} \]
where \(\sigma^2_E\) is the standard deviation of the error, and \(\sigma_X^2\) the standard deviation of the data. Let’s calculate these reliability statistics:
reliability_vparty <- 1 - mean(dat$v2pariglef_sd, na.rm = TRUE) / sd(dat$v2pariglef, na.rm = TRUE)
reliability_marpor <- 1 - mean(dat$se, na.rm = TRUE) / sd(dat$lr, na.rm = TRUE)
If the standard errors are “correct”, then the reliability of the V-Party measure is less than the reliability of the MARPOR measures.
reliability_vparty[1] 0.6373099reliability_marpor[1] 0.7844288(Unfortunately, we have no ground truth to compare these measures too, and so it’s not clear whether the true values of party position are usually +/- one of these standard errors).
Armed with these reliability measures, we can calculate the corrected coefficient.
(rho$estimate / sqrt(reliability_vparty * reliability_marpor)) cor
0.759354 A corrected correlation of 0.75 seems quite a lot better. The two measures continue to disagree, but the correlation is a lot better than what it was before (almost 40% better, in fact).
Correcting for attenuation (2)
The formula given above works well when the amount of measurement error is the same for all measurements. However, when we’re looking at party positions, our measurement error often varies. We are more confident about the positions of large centrist parties than we are about the positions of smaller and/or more radical parties. For this reason, a better gauge of the impact of measurement error comes from a more complicated model, which allows for different degrees of measurement error for different observations.
The model has two components: a regression model, which is entirely standard but for the fact that the outcome and predictor variables are not observed, and a measurement model, which connects the unobserved quantities to measures. Here’s the regression model:
\[ Y^{*} \sim N( \alpha + \beta X^{*}, \sigma) \]
where parameters \(\alpha\), \(\beta\) and $ have to be estimated. The measurement model is then:
\[ Y^{OBS} \sim (Y^{*}, \sigma_{SE_Y}) \]
\[ X^{OBS} \sim (X^{*}, \sigma_{SE_X}) \]
I’ll implement this model in brms, which allows for measurement error in varied (and somewhat inconsistent) ways. I’ll do the model twice over, once using the measures of party position without any correction for measurement error, and once with the measurement error incorporated.
f1 <- bf(lr ~ 1 + v2pariglef)

m1 <- brm(f1,
          data = dat,
          chains = 4,
          cores = 4)
Warning: Rows containing NAs were excluded from the model.Compiling Stan program...Start samplingfixef(m1) Estimate Est.Error Q2.5 Q97.5
Intercept -0.1933080 0.01520839 -0.2232875 -0.1622409
v2pariglef 0.3325624 0.01061600 0.3122534 0.3532442Okay, for every one unit increase in the v2pariglef measure, we go up by one-third of a unit in the MARPOR measure. We can get that up a little bit, can’t we?
f2 <- bf(lr | mi(se) ~ 1 + me(v2pariglef, v2pariglef_sd))

m2 <- brm(f2,
          data = dat,
          chains = 4,
          cores = 4)
Compiling Stan program...Start samplingfixef(m2) Estimate Est.Error Q2.5 Q97.5
Intercept -0.2069727 0.01428796 -0.2348590 -0.1786530
mev2pariglefv2pariglef_sd 0.3750820 0.01121045 0.3530477 0.3967856Here we’ve seen that the coefficient value increases by roughly 0.045 units, making the new coefficient roughly \(.375/.333 = 12\)% greater than it was before. This is less impressive than using a formulaic correction for attenuation, but I trust this correction more.
What does it all mean?
In some sense, correcting for attenuation is a scholastic exercise. “The correlation between these two things would be such-and-such if there was no measurement error” is not very helpful given that there always is measurement error.
At the same time, however, high corrected correlations do give some support to the view that regressions of party positions using different measures of the dependent variable ought to give similar results. The error in the dependent variable, though it might affect the standard errors, won’t affect the slope of the coefficients.
If you want to use party positions to explain something else, you still have a problem. Every time we run a linear regression using imperfectly measured predictor variables, we’ll face the problem of attenuation all over again – and it’s risky to rely on the “what doesn’t kill a significant finding makes it stronger” fallacy. I know that I’ve run regressions like this before, most notably when I tried to predict MP left-right position on the basis of constituency position. In future, I’ll try to make measurement error more seriously.